QPLIB
A Library of Quadratic Programming Instances
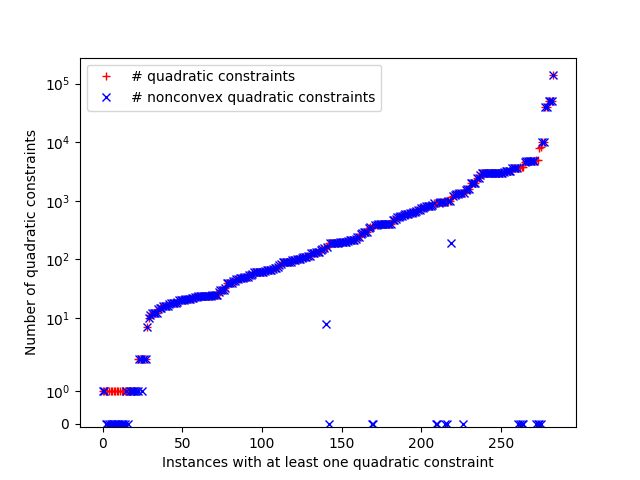
Home // browse instances // view statistics // read documentation // download QPLIB archiveThe following diagrams provide aggregated statistics on sources and characteristics of the instances in QPLIB. You can download the raw data in csv format. The data fields are defined in the documentation.
Problem types
For a definition of the three letter problem classification see the documentation.
Continuous Instances / | Discrete Instances | |||||||||||||||||||||||||||||||||||||||||||||||||||||||||||||||
|---|---|---|---|---|---|---|---|---|---|---|---|---|---|---|---|---|---|---|---|---|---|---|---|---|---|---|---|---|---|---|---|---|---|---|---|---|---|---|---|---|---|---|---|---|---|---|---|---|---|---|---|---|---|---|---|---|---|---|---|---|---|---|---|---|
|
|
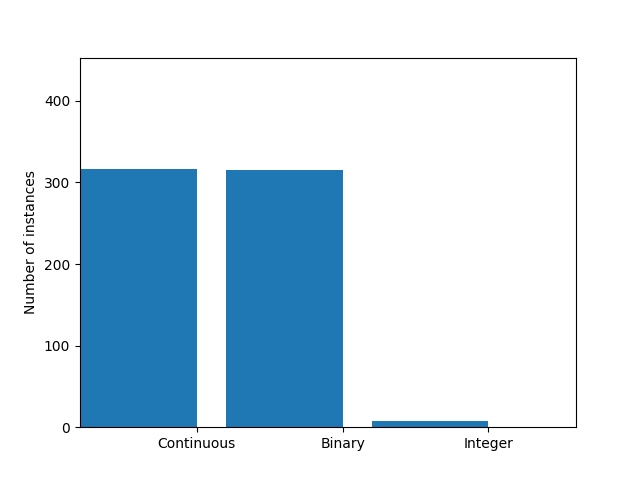
Variable types
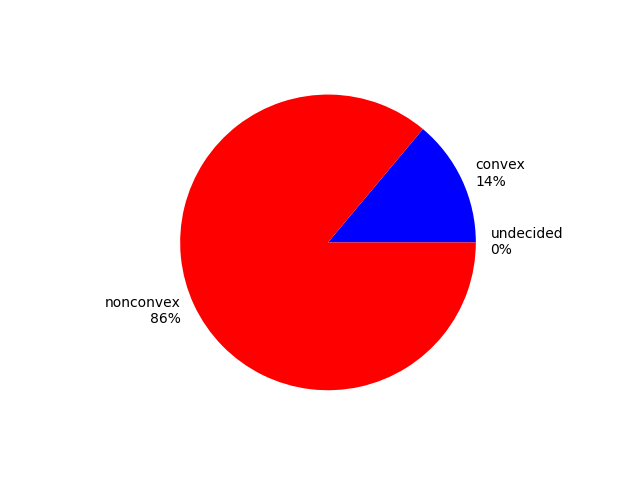
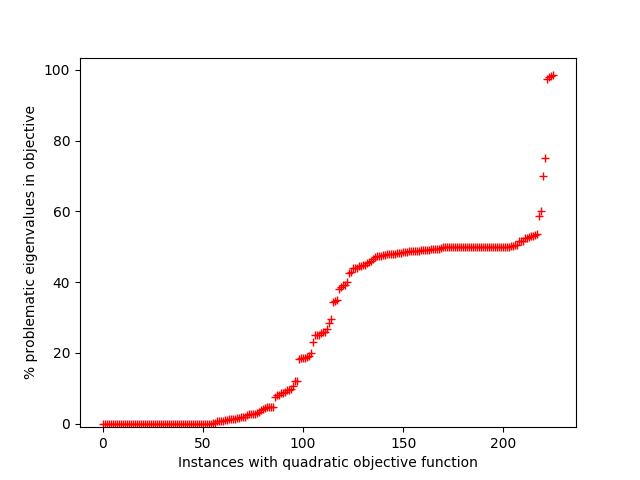
Convexity
Left: Convexity of the continuous relaxation. Right: Fraction of problematic eigenvalues in the coefficient matrix of the objective function w.r.t. the total number of variables.
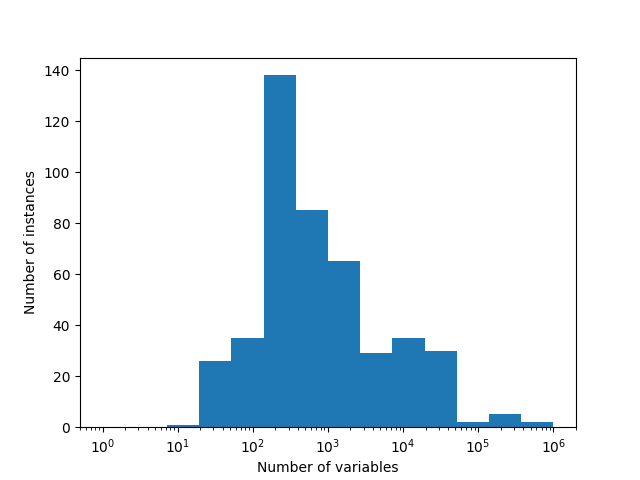
Problem sizes
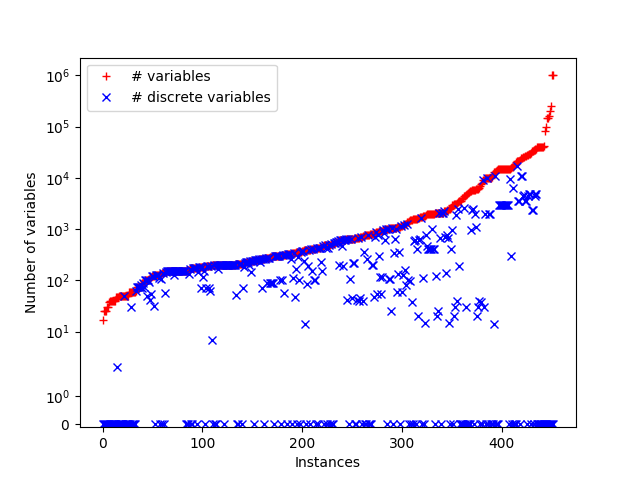
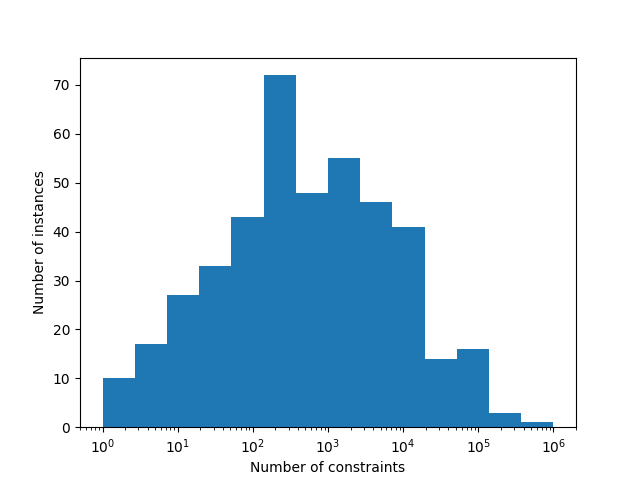
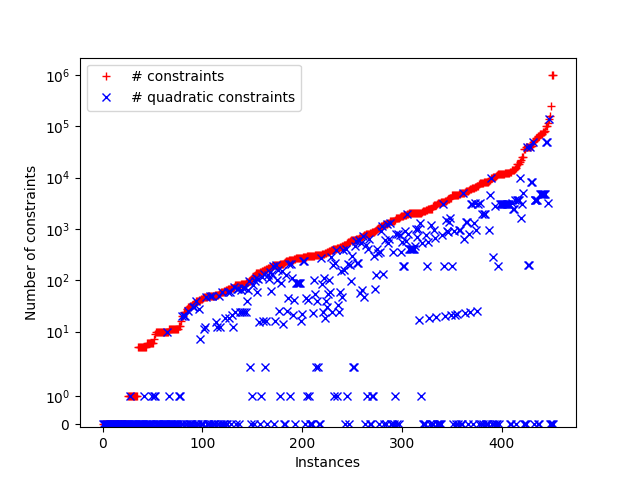
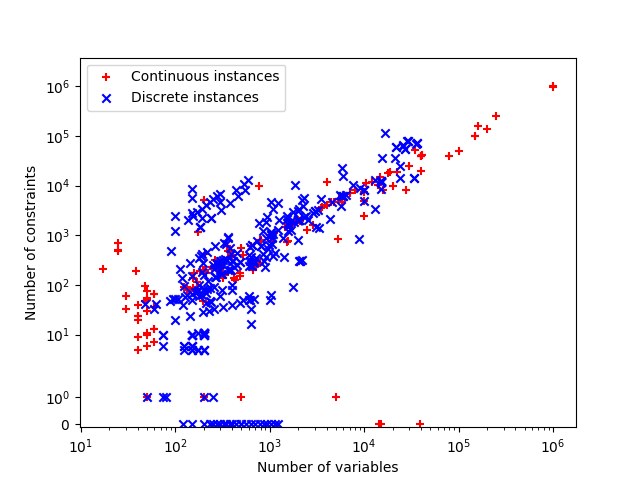
See also the definition of nonzeros and nonlinear nonzeros in the documentation.
Density
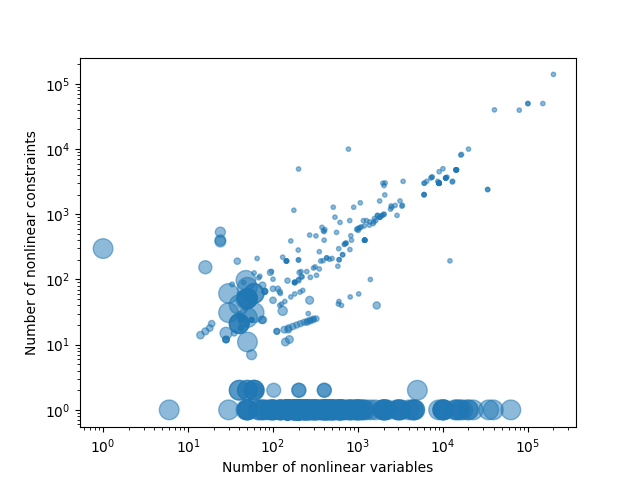
In these scatter plots, each bubble represents an instance and the area of the bubble corresponds to the (nonlinear) density of the instance:
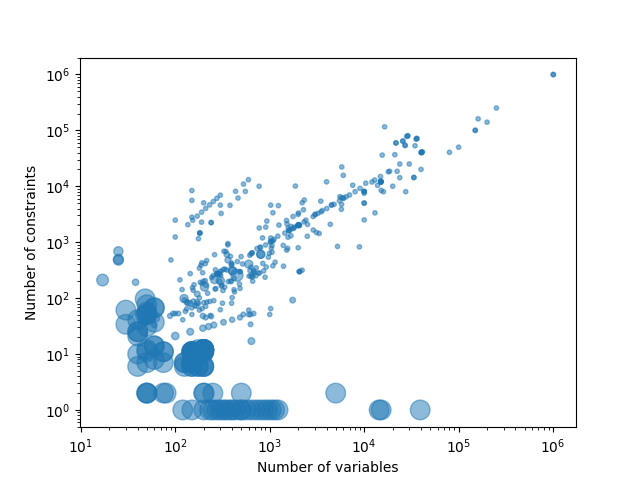
- The density in left scatter plot is defined as (#nonzeros) / (#vars * (#cons + 1)).
- The density in right scatter plot is defined as (#nonlinear nonzeros) / (#nonlinear vars * (#quadratic cons + 1 if objective is nonlinear)).
- Densities below 0.05 are shown as 0.05.
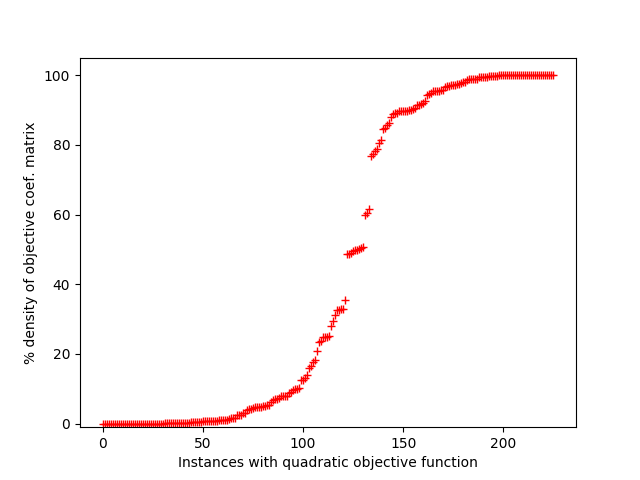
The diagram below shows the instances with a quadratic objective function sorted according to the density of the quadratic objective function coefficient matrix.
Website © 2017-2025 by Zuse Institute Berlin and GAMS. All rights reserved.
Imprint.
QPLIB is licensed under CC-BY 4.0.
